The Readout, Not the Denoiser: Per-Step Integrated Gradients for Diffusion-Policy Vision-Language-Action Models
Independent Researcherarjunbajpai2009@gmail.com
Version 1.0 · 27 August 2026 · doi:10.5281/zenodo.22133507
Abstract
Diffusion-based vision-language-action (VLA) policies perform well on robotic manipulation tasks, but their per-decision reasoning remains opaque. To our knowledge, we present the first per-step, per-modality application of Integrated Gradients (IG) to a diffusion-policy VLA. The method attributes every control decision of the Robotics Diffusion Transformer (RDT) to its vision, language, and state inputs across ManiSkill3 manipulation episodes. It defines a deterministic Gaussian log-density target through a fixed-seed denoising chain and runs at the policy-call level to keep full-episode attribution tractable. We evaluate on four tasks with two seeds, covering 1,341 signal-bearing decisions out of roughly 1,900 attributed policy calls. Median completeness error is 1.9 to 2.5% on vision and language. Vision insertion and deletion area-under-curve (AUC) scores of 0.79 to 0.87 and 0.29 to 0.35 pass pre-specified faithfulness bars. Language AUCs miss most of their bars at 170M, where instructions tokenize to only 16 to 30 tokens. On the fine-tuned RDT-1B, language deletion improves to passing and language insertion is seed-sensitive, passing at two of three evaluation seeds. We then report two structural findings about evaluating attribution on diffusion policies. First, the log-density change under deletion does not track policy competence. A fine-tuned RDT-1B improves its vision AUCs at every one of three evaluation seeds (pooled over all policy calls, vision insertion 0.940, deletion 0.288) while its vision deletion magnitude stays near 0.00015 nats. A direct measurement shows this is an artifact of the per-entry quadratic log-density readout, which maps a small action displacement to a near-zero nat value, and not of the action being held fixed by the denoiser. Ranking-based metrics, not magnitudes, are the right faithfulness tool for this setting. Second, model-randomization sanity correlations persist even under frozen-target and full-backbone randomization. This follows from the input-anchored form of IG, while input randomization remains discriminating and passes ( on vision). Finally, a raw attribution target restores a usable deletion magnitude of 1.23 at in action-space units, while the log-density target yields 0.0014 nats on the same population. It keeps AUCs faithful at a quantified cost in completeness. We release the full pipeline code and the committed per-step metrics records.
1 Introduction
Robotic manipulation policies that fuse vision, language, and proprioceptive state have advanced rapidly. Vision-language-action (VLA) models such as RT-2 [Zitkovich et al., 2023], Octo [Octo Model Team et al., 2024], and the Robotics Diffusion Transformer (RDT) [Liu et al., 2025] execute multi-step tasks from raw sensory input conditioned on natural-language instructions. Diffusion-based policies [Chi et al., 2023] have emerged as a particularly effective family within this class. They generate action chunks through iterative denoising [Ho et al., 2020] and produce smooth, multimodal action distributions that outperform regression-based alternatives on contact-rich tasks.
Despite these advances, diffusion-policy VLAs remain opaque. When a robot fails to grasp an object or misreads an instruction, practitioners cannot tell whether the failure came from visual misattention, language misgrounding, or proprioceptive misreading without inspecting model internals by hand. This limits deployment in safety-critical settings, hampers systematic debugging, and makes it harder for operators to decide when to intervene.
Post-hoc attribution offers a principled path toward interpretability without modifying the policy. Integrated Gradients (IG) [Sundararajan et al., 2017] attributes a model's scalar output to its inputs by integrating gradients along a straight-line path from a baseline to the actual input. It satisfies a completeness axiom that makes the attribution quantitatively checkable. IG has been applied to image classifiers, question-answering and translation systems, and visual question answering models [Sundararajan et al., 2017; Mudrakarta et al., 2018], but to our knowledge not to diffusion-policy VLAs operating in episodic robotic control. Extending it to this setting raises three engineering obstacles. The denoising chain samples noise, and IG requires a deterministic scalar function. The multimodal input space needs distinct baselines and interpolation strategies per modality. Episodic control demands attribution at thousands of decision points across hundreds of episodes.
This paper addresses those obstacles, but its central message concerns evaluation. We find that two expectations inherited from classifier studies fail on diffusion policies for structural reasons, not implementation ones. The first expectation is that deleting highly attributed inputs should move the policy's log-density by a large margin. It fails because the log-density reads the squared action displacement averaged over the action entries, so a small relative displacement becomes a near-zero magnitude no matter how competent the policy is. We demonstrate this with a cross-scale experiment in which a fine-tuned RDT-1B improves its vision ranking scores at every one of three evaluation seeds while its deletion magnitude shrinks below that of a weak 170M policy. The second expectation is that randomizing the model should destroy attribution structure. It fails because IG multiplies every gradient by the model-independent factor (input baseline). We dissect this with frozen-target and full-backbone randomization variants and connect it to the input-anchoring critique of Adebayo et al. [2018]. Both properties matter to anyone who evaluates attribution methods on diffusion policies, and both stay invisible unless the evaluation protocol is designed to expose them. We also show that the magnitude signal is recoverable. Swapping the attribution target from the Gaussian log-density to a raw distance restores a deletion signal more than two orders of magnitude larger, at a quantified cost in completeness precision.
Our contributions are as follows.
- Method. A per-step, per-modality IG framework for diffusion-policy VLAs. It combines a Gaussian log-density target that is deterministic and differentiable through a fixed-seed DPM-Solver++ chain, modality-specific baselines, and per-policy-call attribution that makes full-episode evaluation tractable.
- Evaluation. A complete quantitative protocol (completeness and perturbation faithfulness at , model- and input-randomization sanity at ) on four ManiSkill3 tasks with two seeds, plus an convergence study and an RDT-1B scale check.
- Readout-insensitivity finding. A direct measurement showing the deletion log-density magnitude is structurally insensitive for diffusion policies because it is a quadratic, per-entry-averaged readout of a small action displacement, with ranking-based area-under-curve (AUC) as the appropriate faithfulness metric.
- Target ablation. A raw target recovers a deletion signal more than two orders of magnitude larger while remaining faithful in AUC terms. This exposes an explicit tradeoff between axiom-level precision and perturbation signal.
- Input-anchoring finding. A randomization-depth study (final layer, frozen target, full backbone) showing why model randomization does not collapse IG attributions on VLAs, with input randomization as the discriminating alternative.
2 Related Work
2.1 Attribution Methods
Sundararajan et al. [2017] introduced IG with the sensitivity and implementation-invariance axioms and showed that straight-line path integration satisfies both. Later work has addressed limitations of the vanilla method. Jha et al. [2021] computed attributions over neural stochastic differential equation models to produce smoother attribution maps, and later showed that shaping the injected noise further improves robustness [Jha et al., 2022]. Walker et al. [2024] observed that gradients from saturation regions contribute noise and proposed Integrated Decision Gradients, which concentrates integration on the decision-relevant portion of the path. For vision transformers, metric-driven attributions [Walker et al., 2025b] and information-flow decompositions [Walker et al., 2025a] improve patch-level explanations. Guided IG [Kapishnikov et al., 2021] adapts the integration path to reduce pixel-level noise. Petsiuk et al. [2018] introduced the insertion and deletion curves we adopt as ranking-based faithfulness metrics. The reliability of perturbation metrics is itself an active concern. Hooker et al. [2019] evaluate attributions by retraining on ablated inputs. Rong et al. [2022] show that deletion without retraining leaks information through the shape of the mask itself, and Tomsett et al. [2020] find that common saliency metrics are themselves unreliable. Our structural findings add a diffusion-policy instance of that caution, where the readout convention rather than the ranking drives the magnitude verdict. Adebayo et al. [2018] established model and data randomization as necessary sanity checks. They also observed that attribution methods carrying a multiplicative input term remain partially invariant to model randomization. Our results extend that observation to a new model class. We measure the invariance across randomization depths on a diffusion-policy VLA and trace it to the same input-anchored form. For diffusion generative models in the image domain, cross-attention maps have been used to attribute generated pixels to prompt tokens [Tang et al., 2023]. Such methods explain generated images rather than executed control actions, and they carry no completeness guarantee.
These methods target classifiers, language models, or image generators. We extend IG to diffusion-policy VLAs, which requires handling stochastic denoising, action-chunk outputs, and multimodal inputs inside an episodic control loop.
2.2 Vision-Language-Action Models
VLA models unify perception, language understanding, and action generation. RT-2 [Zitkovich et al., 2023] fine-tunes a vision-language model to emit discretized actions as token sequences. Octo [Octo Model Team et al., 2024] trains a generalist policy on a large multi-robot dataset with a transformer backbone. Diffusion Policy [Chi et al., 2023] frames action generation as conditional denoising diffusion [Ho et al., 2020]. It produces action chunks by iterative refinement rather than single-step regression. RDT [Liu et al., 2025] scales this approach with a Diffusion Transformer (DiT) backbone, a SigLIP vision encoder [Zhai et al., 2023], and a T5-XXL language encoder [Raffel et al., 2020]. RDT processes six camera slots (three camera views over a two-frame history) through SigLIP into 4,374 vision tokens. It combines them with up to 1,024 language tokens and a 128-dimensional unified state vector, and it generates 64-step action chunks through a five-step DPM-Solver++ [Lu et al., 2025] denoising schedule. This multimodal, multi-step architecture makes RDT a compelling but challenging target for attribution.
2.3 Interpretability in Robotics
Prior work on explaining robotic policies has focused on reinforcement learning agents in discrete-action settings. Greydanus et al. [2018] applied perturbation-based saliency to Atari agents, and counterfactual methods [Amitai et al., 2024] contrast the outcomes of executed and alternative actions for policy explanation. In continuous control, VisualBackProp [Bojarski et al., 2018] visualizes convolutional neural network (CNN) saliency for end-to-end driving policies. That setting is single-modality behavior cloning and offers no quantitative attribution guarantees. To our knowledge, no prior work provides per-step, completeness-checked, multimodal gradient attribution for diffusion policies in episodic control, together with quantitative attribution-quality metrics across complete manipulation episodes.
3 Method
3.1 Integrated Gradients Preliminaries
Given a differentiable function , an input , and a baseline , the integrated gradient along dimension is
The completeness axiom guarantees . We approximate the integral with a uniform Riemann sum of steps, giving
The approximation error of this uniform average shrinks as grows, and non-smooth integrands converge more slowly than smooth ones. That fact matters again in Section 6.2.
3.2 A Deterministic Target Through the Denoising Chain
RDT generates actions with a DPM-Solver++ [Lu et al., 2025] chain of denoising steps. At each policy call the model receives an observation made of vision tokens, language embeddings, and proprioceptive state, and it produces a denoised action mean . Under RDT's sample-prediction parameterization, is directly the chain's final output. The primary attribution target is proportional to the Gaussian log-density of the executed action,
with and the constant entropy term dropped. Here is the number of active action entries, namely the 64-step chunk over the eight active dimensions. The target is therefore proportional to the negative mean squared deviation per entry, and its scale does not depend on chunk length. We write for changes in this target throughout. The reference action is computed once under a fixed random seed with gradients disabled. This makes a deterministic, differentiable function of the input.
Seeding the diffusion noise is critical. Without it, each of the forward passes in Eq. 2 would draw independent noise. That would make stochastic, leave IG undefined, and break the completeness identity. We re-seed the generator identically before every forward pass, so all evaluations share one noise realization. Each gradient in the Riemann sum is additionally guarded, with any non-finite values zeroed before accumulation, and any material effect of this guard would surface in the measured completeness error.
3.3 Alternative Scalar Targets
The Gaussian log-density is the canonical choice, but it is not the only scalar that is maximized when the perturbed action equals the reference. We evaluate two alternatives, defined as
Both are computed over the same active action entries as Eq. 3, and the norm carries a small numerical stabilizer inside the square root. We abbreviate the maximum-deviation target as maxdev in tables and prose. The raw distance grows linearly rather than quadratically as the action mean moves away from the reference, so its gradient does not vanish near the optimum. The maximum-deviation target is sensitive to the single most perturbed action entry. The alternative targets are monotone in the same deviation as Eq. 3 but do not share its units. Cross-target magnitude comparisons therefore speak to practical signal availability rather than to unit-identical quantities. Section 6.2 evaluates all three.
3.4 Per-Step Episode Attribution
RDT outputs action chunks of 64 steps, subsampled to 16 environment steps. We run IG once per policy call, not per environment step, because the chunk is the atomic unit of decision. Per-call attribution costs about one minute per decision on RDT-170M at . Attributing every environment step would multiply that cost by the 16 subsampled steps per chunk and put a full pass beyond practical budgets. The per-call choice is what makes full-episode evaluation tractable.
At each policy call we compute three independent attributions through modality-specific forward functions.
- Vision. Freeze language and state and interpolate the adapted image tokens from the baseline to the real observation.
- Language. Freeze vision and state and interpolate the adapted language tokens from a minimal two-token baseline encoded through T5-XXL to the real instruction embedding.
- State. Freeze vision and language and interpolate the 128-dimensional unified state vector (eight active dimensions for the Franka arm, namely seven joints plus the gripper) from zeros to its real value. The state-adaptor multilayer perceptron (MLP) sits inside the forward function to preserve per-joint structure.
Algorithm 1 summarizes the procedure.
Input. Policy , environment , integration steps , target
Output. Attributions at every policy call.
- for policy call
- Encode into vision , language , state
- Compute with fixed seed, no grad
- Define from , the denoised mean , and the chosen target
- for modality
- Set baseline , input
- Freeze the other two modalities
- Eq. 2
- end for
- Record and completeness errors
- Apply action chunk and advance by 16 steps
- end for
Baseline selection.
The vision baseline is a uniform gray image in the external-camera slot only. The remaining five camera slots carry constant background images and are frozen at their real values, so IG attributes only to the informative slot. The language baseline is a minimal two-token sequence (the tokenizer's padding and end-of-sequence tokens, since T5 has no beginning-of-sequence token) encoded through T5-XXL rather than a zero vector. The encoder output is zero-padded to the stored embedding length, and the language forward passes attend over the task's real token span. The attended baseline is therefore the encoded token pair followed by zero vectors at the remaining attended positions. A zero vector is numerically safe through the GELU-based language adaptor, where GELU is the Gaussian error linear unit, but is semantically degenerate, and it roughly doubled the completeness error in preliminary single-step tests. The state baseline is a zero vector in the normalized joint space, a numerically safe choice that keeps per-joint attributions readable. Section 6.3 quantifies sensitivity to the vision baseline choice.
3.5 Evaluation Protocol
We evaluate along three axes against fixed quantitative bars. The metrics follow Sundararajan et al. [2017], Petsiuk et al. [2018], and Adebayo et al. [2018]. The numeric bars are pre-specified targets set for this study before the runs, not community standards. The AUC bars sit on the far side of the roughly 0.5 value that a random ranking yields under the rescaling defined below. Reported 95% intervals are episode-resampled percentile bootstrap intervals with draws and a fixed resample seed, computed by the released interval scripts, so correlated rows within an episode stay together.
Correctness.
We measure the completeness error
per modality at every policy call. Completeness is evaluated per modality, with the other two modalities frozen, rather than as one joint sum over all modalities, because each modality has its own forward function and baseline. The bars are a median error at or under 3% and at least 90% of cases at or under 3%.
Faithfulness.
We run two perturbation tests. Top- deletion ranks inputs by , replaces the top with the baseline for , and measures , which should be negative. The bar at is nats. Insertion/deletion AUC [Petsiuk et al., 2018] progressively inserts tokens starting from the baseline, or deletes them starting from the input, in IG-ranked order over . We compute the AUC after rescaling so that the full input maps to 1 and the baseline to 0. The ranked units are the 729 external-camera patch tokens for vision and the real instruction tokens for language. The bars are vision insertion at or above 0.60 and deletion at or below 0.40, and language insertion at or above 0.55 and deletion at or below 0.45. The nat scale of is set by the target's normalization conventions, namely and the per-entry mean over . An alternative sum-form convention without the factor would scale every reported by (Section 6.1). The magnitude bar applies to the target as implemented, and every comparison in this paper holds these conventions fixed.
Sanity.
C1 (model randomization) re-initializes model weights with Xavier-uniform draws and re-runs IG. Attributions should decorrelate from the original, with Spearman . We run three variants of increasing strictness. The standard variant re-initializes the output projection of the final action layer and recomputes the target under the perturbed model. The frozen-target variant re-initializes the same projection but keeps the original model's reference action, which is the strict form of the test. The cascade variant re-initializes every backbone weight matrix and positional embedding (107 tensors) with the frozen target. C2 (input randomization) applies a deterministic pixel permutation to the external-camera image and a post-encoding token-order shuffle to the language embedding, then re-runs IG with the same bar. C1 follows the model-randomization test of Adebayo et al. [2018], while C2 is an inference-time input-randomization check in the same spirit. Correlations are computed over the 729 external-camera patch scores for vision, the real instruction tokens for language, and the eight active state dimensions. All sanity re-runs compute the perturbed attribution at on the first 50 steps of each task-seed base run and correlate it against that run's original attribution. The standard C1 and C2 rows use the main pass as the base run, while the frozen and cascade variants use the regeneration run described in Section 4. The standard C1 result (, Section 5.3) doubles as a control showing that the budget mismatch alone does not decorrelate attributions. The stored attribution sidecars, the per-policy-call attribution tensors, reference action, observation, and proprioceptive state saved alongside each run, encoded neither the integration budget nor the episode seed in their filenames until a tagging fix that postdates every run described in this paragraph. Both consequences are disclosed. First, the extension ran concurrently with the variant sanity stages on PegInsertionSide and PickSingleYCB, so some frozen-target and cascade rows for those two tasks may correlate against attributions rather than ones. Second, the two seeds of each pre-fix run wrote to the same sidecar paths, with the second seed writing last, so every pre-fix stage that loaded sidecars for the first seed is exposed to having consumed the second seed's tensors, mixing the second seed's attribution rankings and observations with the first seed's noise seeding and row filtering. A provenance fingerprint is released with the code: the step record's expected completeness gap must equal the faithfulness record's recomputed baseline value exactly when a row's own sidecar was loaded, and the released audit script runs this check over every committed step and faithfulness record pair. The fingerprint proves that this consumption occurred for the two seed-42 faithfulness records, which agree with their own step records on 0% of rows, while every post-fix record agrees on 100% of rows. The affected populations and the re-certification of the affected verdicts are recorded with Table 2, Table 3, and the reproducibility statement. The standard C1 control bounds the budget effect; on the unambiguous PickCube and StackCube seed-142 subset, the frozen vision/language medians are 0.915/0.842 against the pooled 0.929/0.862 and the cascade vision/language medians are 0.712/0.911 against 0.713/0.910; no sanity verdict depends on either ambiguity.
Baseline sensitivity.
For the vision modality we recompute IG under three baselines per step (black, gray, and a Gaussian blur of the actual observation) and report pairwise Spearman correlations of the patch rankings.
4 Experimental Setup
Models.
RDT-170M [Liu et al., 2025] (14 DiT layers, 1024-dim hidden) is the primary model, used with pretrained-only weights. This is deliberate. A policy without task-specific fine-tuning exercises the attribution machinery on realistic failure behavior, and its near-zero task success (1 success in 400 episodes) supplies the failure side of the qualitative analysis. RDT-1B (28 layers, 2048-dim) serves as the scale check on PickCube with the original authors' fine-tuned weights, a checkpoint that can solve the task. An initial scale-check run produced 7/20 successes. A re-run of the same checkpoint for the faithfulness evaluation, on the follow-up machine and under the deviations recorded below, produced 9/20. A Month 5 reproduction run of the same checkpoint and seeds with real T5-XXL embeddings on a third machine produced 8/20 successes, and its records are committed. Its vision faithfulness medians fall inside the episode bootstrap intervals of the committed run (insertion 0.919 against 0.926 and deletion 0.264 against 0.248).
Tasks.
We evaluate on four ManiSkill3 [Tao et al., 2024] manipulation tasks with a simulated Franka Panda seven-degree-of-freedom (7-DoF) arm. PickCube-v1 grasps a cube and lifts it to a target. StackCube-v1 stacks a red cube on a green cube. PegInsertionSide-v1 inserts a peg into a hole from the side. PickSingleYCB-v1 grasps a Yale-CMU-Berkeley (YCB) object. Each task is conditioned on a natural-language instruction encoded offline through T5-XXL. Tables abbreviate PegInsertionSide-v1 and PickSingleYCB-v1 as PegInsertion and PickYCB. We record five protocol deviations up front. The run campaigns are labeled by project month, Month 4 through Month 7, and the released records and data README use the same labels. The original task list named OpenDrawer, which exists only as a Fetch-mobile-manipulator variant in the installed ManiSkill3, so it was dropped. PickSingle does not exist under that name, so the published PickSingleYCB-v1 was substituted. A fifth task, TurnFaucet-v1, was attempted as an articulation substitute and dropped during the pass. Its reference-action norms declined steadily from the first step toward the signal threshold, the opposite of every other task, and the run was producing no successes for its pod cost. The Month 4 follow-up machine could not host T5-XXL, so every follow-up run on it loaded the authors' precomputed instruction embeddings and a zeroed placeholder in place of the encoded two-token language baseline. The affected language numbers are the seed 42 RDT-1B language values reported with Table 2, the variant language correlations in Table 3, and the regeneration-run and -overlay language distributions in Figure 1. Comparisons between them and main-pass language numbers therefore span two baselines, while the vision and state baselines are unchanged. The Month 6 runs at seeds 142 and 242 encoded their instruction embeddings and the two-token language baseline with T5-XXL on their own machine, so the pooled 1B language row in Table 2 spans both language-baseline provenances. The follow-up PickSingleYCB runs also reused the PickCube instruction embedding because the task's own embedding was unavailable, so no per-task language metrics are tabulated from them. The PickSingleYCB language distributions in Figure 1 carry that proxy embedding, and the pooled variant language correlations include those proxy rows.
Protocol.
The full evaluation pass is 4 tasks 2 seeds (42, 142) 50 episodes at . It yields roughly 1,900 attributed policy calls, of which 1,341 are signal-bearing and enter the quantitative tables. A step is signal-bearing when the reference action norm is at least 15. Quiescent steps are excluded because the completeness denominator is ill-conditioned when the action mean barely moves. Seven follow-up runs extended the protocol. An subset covered PickCube and StackCube (2 seeds 8 episodes) and was later extended to PegInsertionSide and PickSingleYCB at the same scope. A configuration fix raising the episode-step ceiling landed between the pass and all later runs. As a result, later episodes typically run to 25 policy calls while the original episodes were shorter. Matched comparisons in Section 6.4 truncate the rows to the episode shape. A regeneration run repeated all four tasks at (2 seeds 15 episodes, post-fix configuration) to supply base attributions for the variant sanity checks, the baseline study, and the target ablation. The target ablation re-ran PickCube at the same scope once per alternative target. The 1B faithfulness run covered PickCube at three evaluation seeds (42, 142, 242), 20 episodes each at , with the seed 42 row kept from the earlier follow-up run and seeds 142 and 242 added later. A displacement run measured the action change under top-ranked deletion directly in action space on PickCube and StackCube at both model scales. It swept solver steps , the denoising-step count of Section 3.2, and deletion fractions up to 20% on vision and language, with rankings taken from the attributions. The reported vision curves pool the 1B runs over seeds 42 and 142, use seed 42 at 170M, and carry 8 to 40 episodes per curve. A Month 5 reproduction run repeated the 1B faithfulness with real T5-XXL embeddings. A Month 7 verification pass repeated the full evaluation pass, the faithfulness stage, and the standard sanity checks at the main-pass scope with seed-tagged sidecars, together with a clean rerun of the seed-42 arm, following the external audit of the sidecar filename scheme disclosed in Section 3.5, and its records are committed.
Hardware.
The main pass ran on a single RTX 4090 (24 GB). The original subset (PickCube and StackCube) ran on an RTX 5090 (32 GB, PyTorch 2.8 with CUDA 12.8). The extension to the other two tasks and the remaining Month 4 follow-up experiments ran on a machine with two RTX 4090s. The displacement measurement and the Month 5 reproduction run used a RunPod RTX PRO 6000 Blackwell (96 GB), which hosted T5-XXL and therefore used real instruction embeddings. The Month 6 runs (the seed 142 and 242 RDT-1B faithfulness runs, the matched-population ablation, and the seed 142 displacement runs) ran on a second RunPod RTX PRO 6000 pod. That pod encoded its own T5-XXL instruction embeddings and two-token language baseline. T5-XXL instruction embeddings are precomputed offline, so the 4.8B-parameter encoder never resides in GPU memory during attribution.
5 Evaluation Results
We first report the protocol results, flagging threshold misses on the deletion magnitude, the language AUCs, the completeness tail, and the state median, together with the expected C1 failure. Section 6 isolates their causes experimentally.
5.1 Correctness
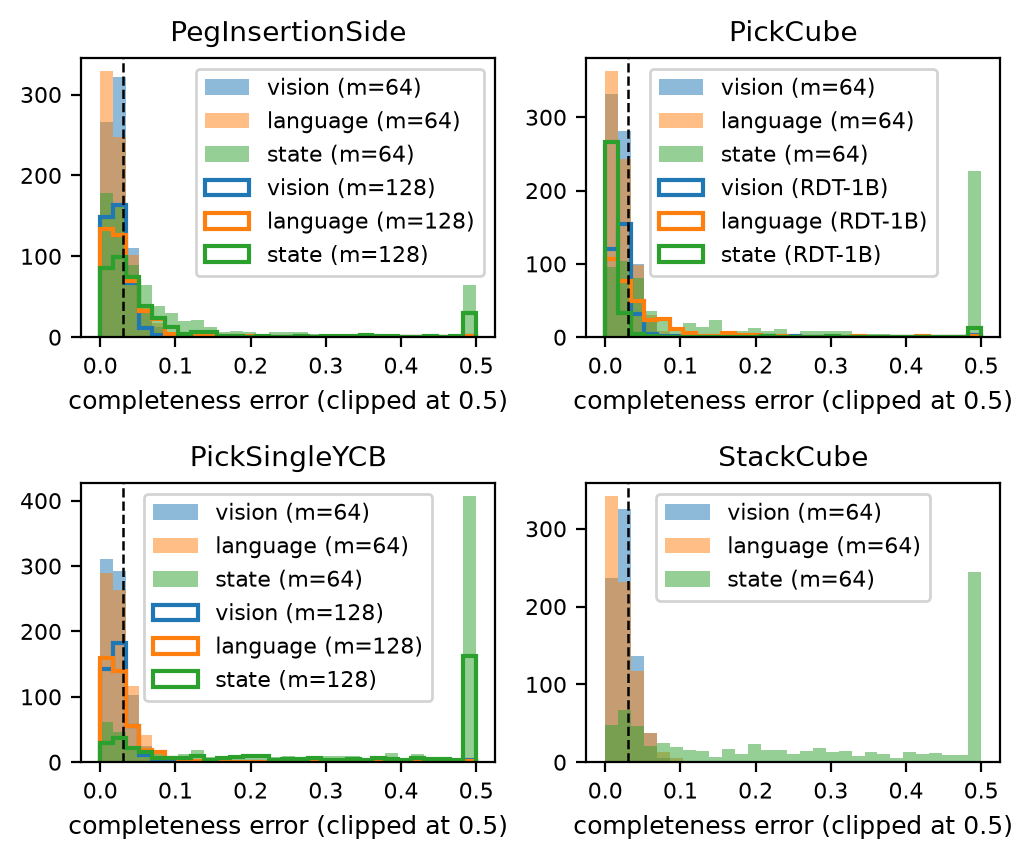
Table 1 reports completeness error at on the main pass's signal-bearing rows, and Figure 1 plots per-task error distributions over all policy calls of the committed regeneration run, which corroborates the main-pass protocol on released records. Vision and language medians cluster at 1.87 to 2.54%, under the 3% bar on all four tasks. State medians are higher, at 4.53 to 7.46%, because the state vector's eight active dimensions accumulate per-dimension Riemann error and its small target gaps amplify the percentage. The 90%-of-cases bar is missed at . Vision pass rates land at 59.9 to 75.8% and language at 67.0 to 75.0%, because the upper 24 to 40% of rows carry Riemann error above 3%. Section 6.4 shows this tail is an integration-budget effect on the smooth tasks.
| Task | Vision | Language | State | ||||
|---|---|---|---|---|---|---|---|
| med | 3% | med | 3% | med | 3% | ||
| PegInsertion | 425 | 2.11 | 75.8 | 1.95 | 73.9 | 4.70 | 37.9 |
| PickCube | 264 | 2.02 | 68.6 | 2.08 | 67.0 | 5.12 | 34.8 |
| PickYCB | 348 | 2.06 | 69.8 | 2.06 | 67.8 | 4.53 | 36.5 |
| StackCube | 304 | 2.54 | 59.9 | 1.87 | 75.0 | 7.46 | 25.3 |
5.2 Faithfulness
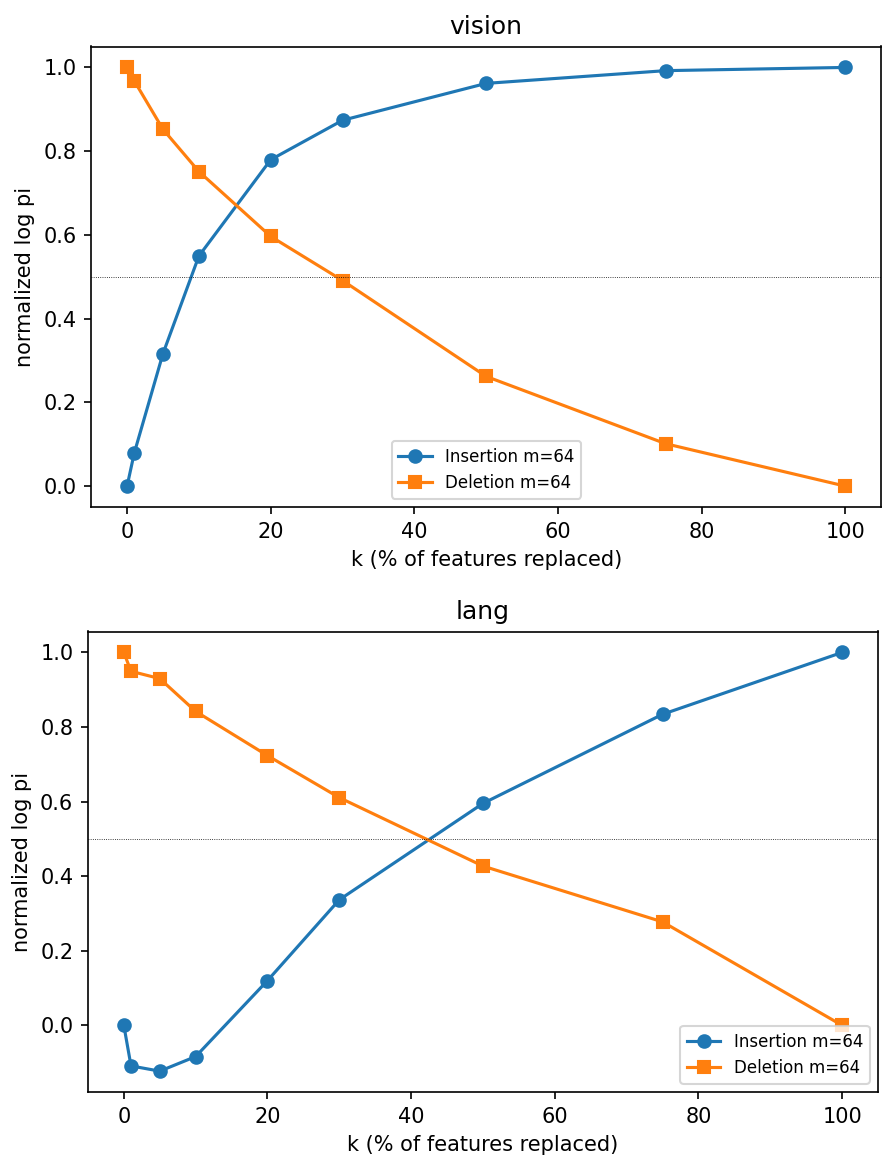
Table 2 reports faithfulness at on the same signal-bearing population, with the RDT-1B scale check in the bottom block. Vision insertion AUC ranges from 0.792 to 0.866 against a 0.60 bar. Vision deletion AUC ranges from 0.290 to 0.345 against a 0.40 bar. Both pass on all four tasks. Inserting highly attributed patches rapidly recovers the target and deleting them degrades it, so the attribution ranks the right pixels. Figure 2 shows the aggregated insertion and deletion curves. Language AUCs are mixed, with insertion between 0.344 and 0.504. Each instruction tokenizes to only 16 to 30 tokens, so a top-1% deletion already removes a full token and the -grid is coarse relative to the sequence length. The pretrained-only policy itself compounds this, since on the fine-tuned 1B the language deletion AUC improves to passing and the insertion AUC improves but passes at only two of the three seeds (Table 2, bottom block). That comparison spans the language-baseline deviation recorded in Section 4.
| Task | Mod. | Ins | Del | ||
|---|---|---|---|---|---|
| PegInsertion | Vision | 425 | −0.0018 | 0.792 | 0.290 |
| Lang. | 425 | −0.0039 | 0.344 | 0.249 | |
| PickCube | Vision | 264 | −0.0032 | 0.856 | 0.317 |
| Lang. | 264 | −0.0004 | 0.504 | 0.477 | |
| PickYCB | Vision | 348 | −0.0013 | 0.843 | 0.345 |
| Lang. | 348 | −0.0003 | 0.368 | 0.477 | |
| StackCube | Vision | 304 | −0.0039 | 0.866 | 0.336 |
| Lang. | 304 | −0.0016 | 0.378 | 0.539 | |
| RDT-1B s42 | Vision | 320 | −0.00016 | 0.926 | 0.248 |
| RDT-1B s142 | Vision | 480 | −0.00012 | 0.937 | 0.293 |
| RDT-1B s242 | Vision | 399 | −0.00018 | 0.954 | 0.314 |
| RDT-1B pool | Vision | 1,199 | −0.00015 | 0.940 | 0.288 |
| RDT-1B pool | Lang. | 1,199 | −0.00012 | 0.541 | 0.267 |
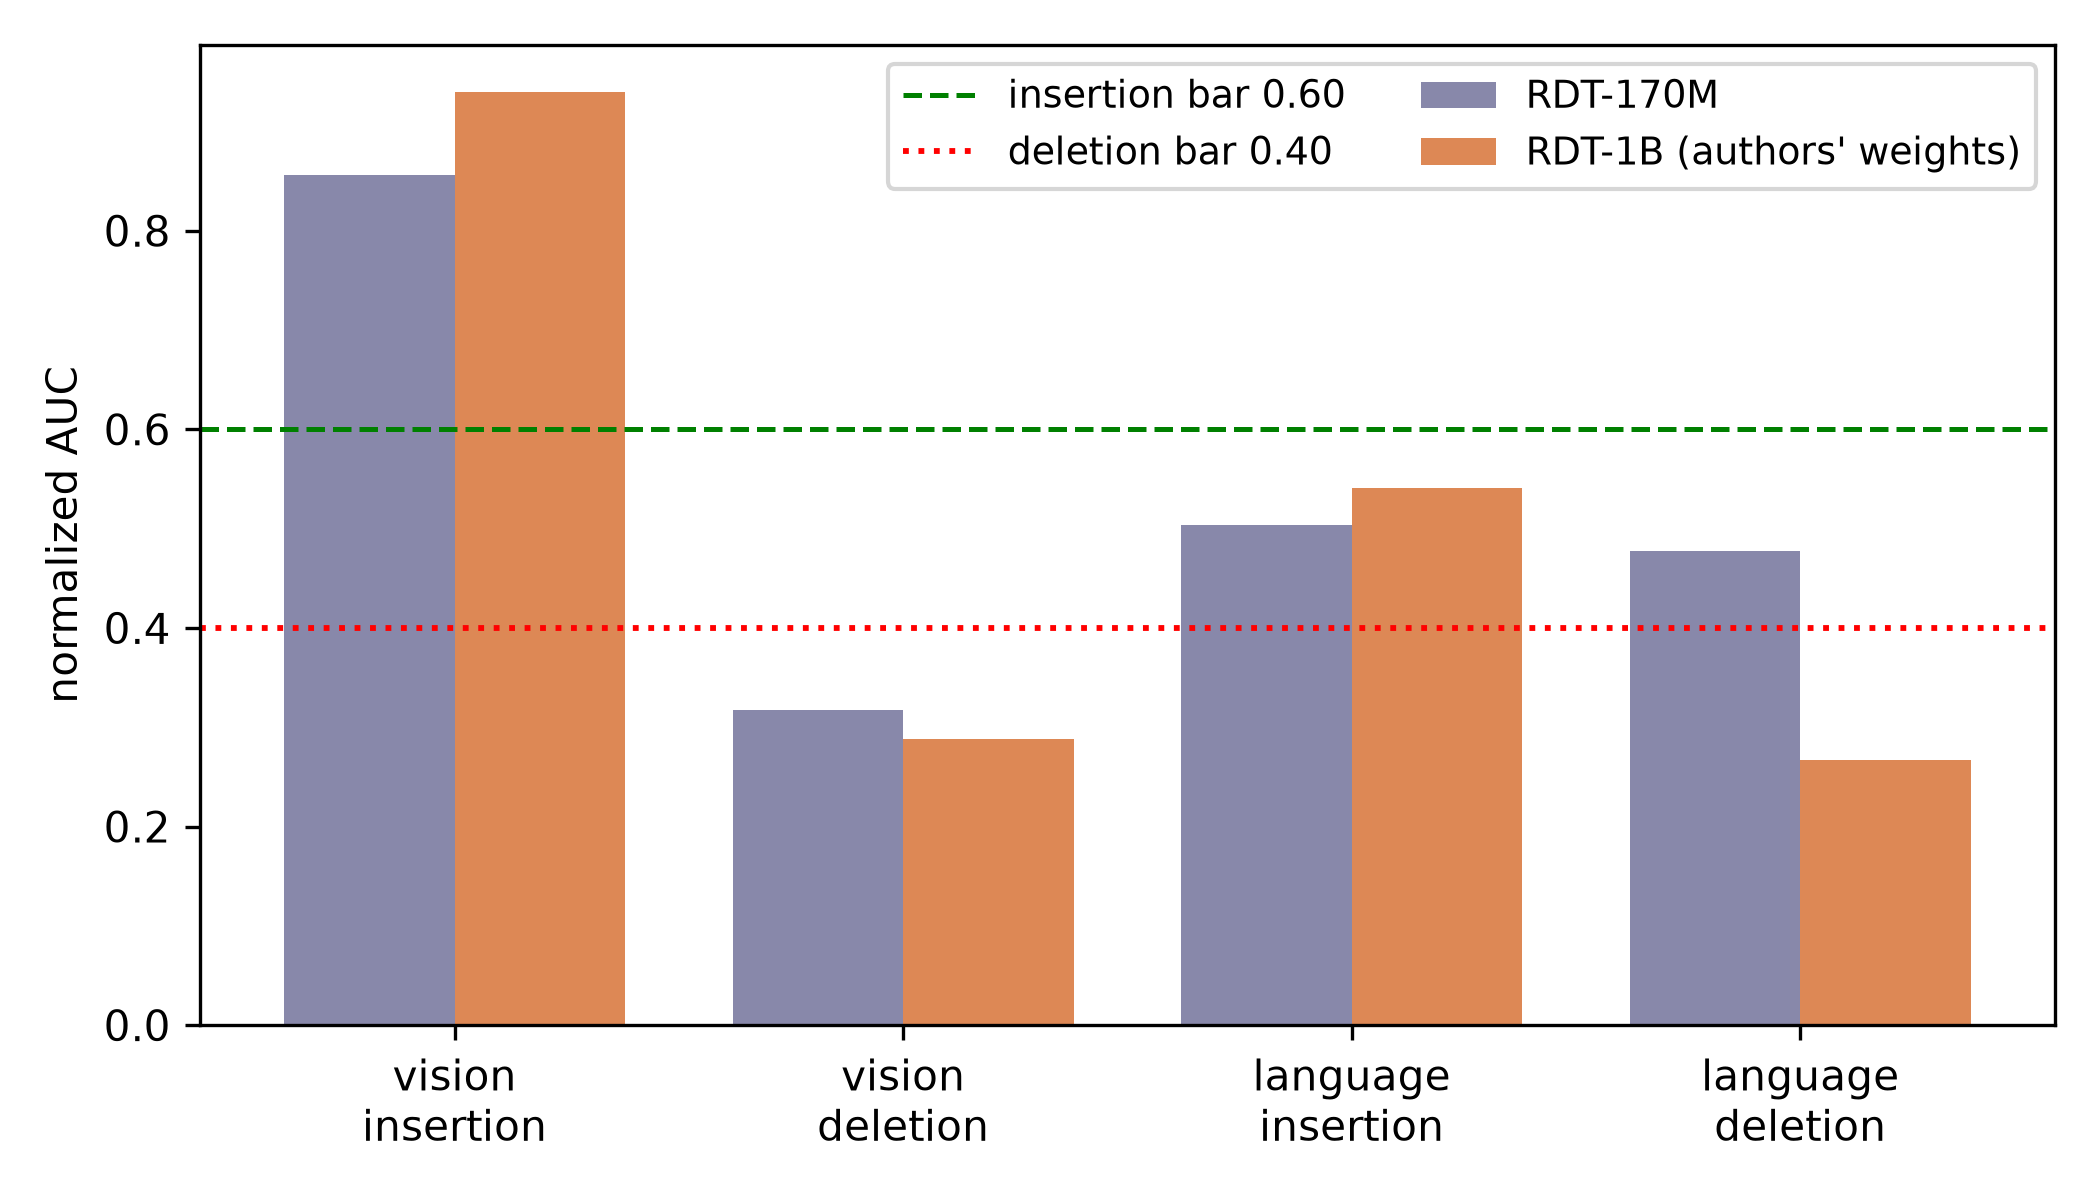
The magnitudes are the protocol's clearest miss. They sit at a few nats or below at on every task and modality, at least two orders of magnitude under the 0.5-nat bar in the per-entry convention of Eq. 3. The natural suspicion is the weak policy, and the 1B experiments behind the bottom block of Table 2 were run to test exactly that. They show the opposite (Section 6.1). Across three evaluation seeds the fine-tuned policy passes both vision bars and the language deletion bar at every seed, while its pooled vision deletion magnitude shrinks by a further 20 (language by roughly 3). The one marginal case is language insertion, which passes at two of the three seeds while its pooled value sits just under its bar, so we read that pass as seed-sensitive rather than robust.
5.3 Sanity Checks
Table 3 reports Spearman correlations between original and perturbed attributions. C2 (input randomization) passes for vision on all four tasks, with from 0.091 to 0.166, and for language on three of four. StackCube sits at 0.240, which is borderline, because its instruction repeats the content tokens naming the two cubes, with cube appearing three times alongside red and green, and a position shuffle is less destructive there. State C2 stays high by construction, at 0.667 to 0.810, because shuffling camera pixels does not perturb the proprioceptive input that drives state attribution.
C1 (model randomization) does not pass in any variant. The standard variant lands at from 0.903 to 0.970 on vision and language. The strict frozen-target variant eliminates the possibility that the correlation is an artifact of the target moving with the perturbed model, yet it barely moves the vision correlation (). Even re-initializing the entire backbone leaves . Section 6.3 shows this is a property of input-multiplied attribution methods rather than a defect of the pipeline, and explains why C2 is the check that carries discriminative weight.
| Task | Check | Vision | Lang. | State |
|---|---|---|---|---|
| PegInsertion | C1 | 0.953 | 0.950 | 0.786 |
| C2 | 0.091 | 0.002 | 0.667 | |
| PickCube | C1 | 0.937 | 0.903 | 0.750 |
| C2 | 0.160 | 0.087 | 0.810 | |
| PickYCB | C1 | 0.918 | 0.917 | 0.714 |
| C2 | 0.166 | 0.141 | 0.762 | |
| StackCube | C1 | 0.953 | 0.970 | 0.667 |
| C2 | 0.157 | 0.240 | 0.786 | |
| C1 frozen (pooled) | 0.929 | 0.862 | 0.643 | |
| C1 cascade (pooled) | 0.713 | 0.910 | 0.643 | |
5.4 Qualitative Analysis
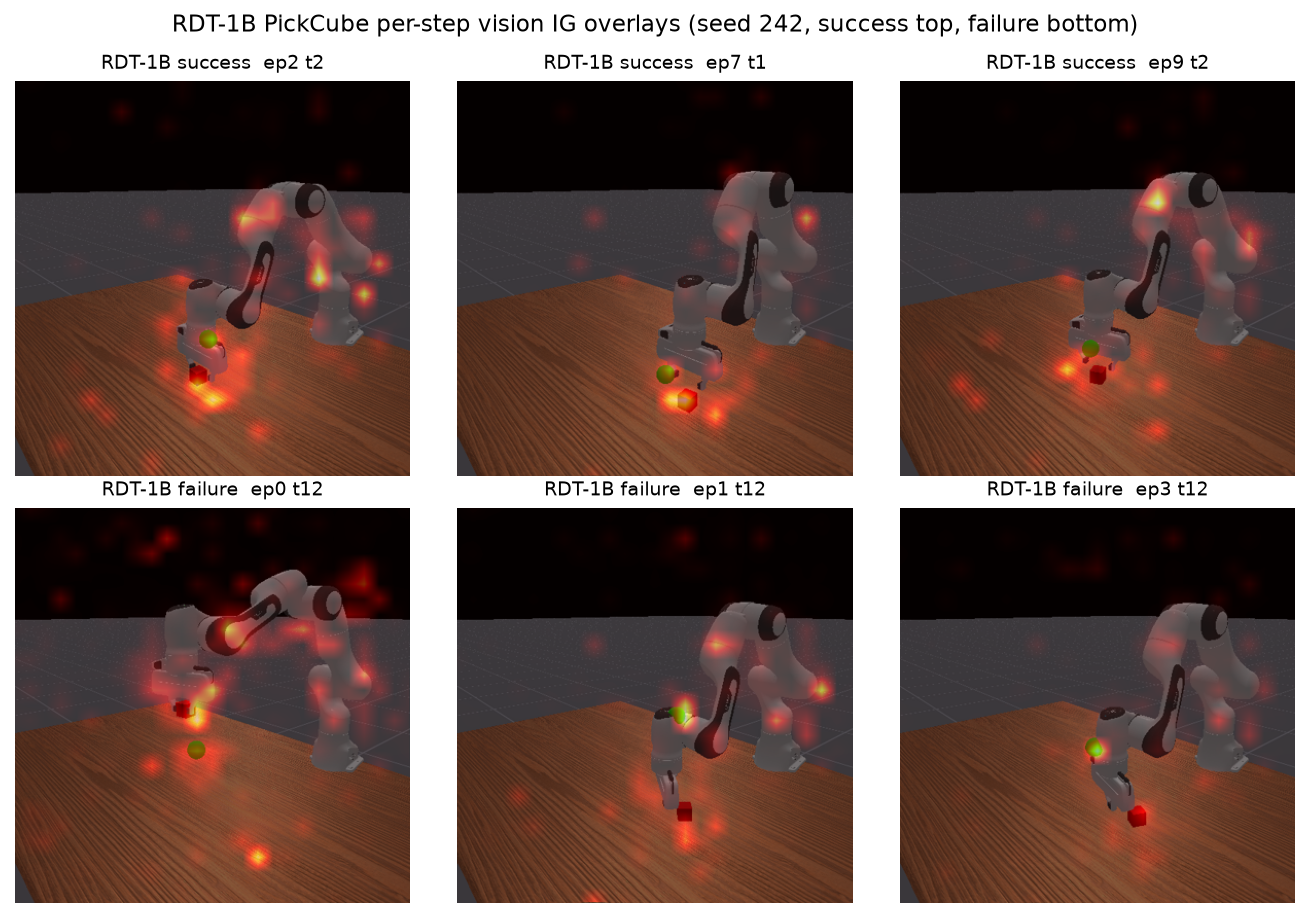
Figure 3 shows six representative vision overlays from a single checkpoint, the fine-tuned RDT-1B on PickCube at evaluation seed 242. The top row is three successes and the bottom row is three failures, taken as the first three of each by episode index rather than hand-picked, with a representative mid-trajectory step shown per episode. In the success panels, attribution concentrates on the target cube and the gripper's approach vector. In the failure panels, the attribution pattern is mixed, with some panels scattering attribution across the scene and others concentrating on task objects despite the failed outcome. Because both rows come from the same checkpoint and the same run, this is a controlled within-checkpoint contrast rather than a cross-checkpoint one, and it shows that attribution placement alone does not separate success from failure here.
In inspected examples, the per-step language attribution bars peak on the content tokens that name the target object, such as red and cube on PickCube. Section 6.3 bounds how much of this token-level structure is model-dependent. Language rankings survive even full-backbone randomization at , so token bars locate the inputs that anchor the attribution but do not by themselves certify grounding by the trained model.
An annotation pipeline tags 16 representative steps (2 successes from the 1B run and 14 failures from 170M across all four tasks) into five categories. The categories are assigned algorithmically from the per-modality completeness signature of each row. They are vision misfocus, language misgrounding, state misreading, delayed credit, and success-well-grounded. The selection is stratified, with representative rows per category and task, so it catalogs the failure modes the signatures can distinguish rather than measuring their prevalence. The overlay grid and the annotation set both deviate from the original protocol's two-successes-per-task composition, which the 1-in-400 success rate makes unsatisfiable. In total the overlay pipeline emitted 3,881 PNG artifacts (per-step overlays, token bars, episode summaries, and combined three-panel figures) across the full pass.
6 From Misses to Mechanisms
The token-grid coarseness and the partial 1B improvement in Section 5.2 explain much of the language AUC miss, though language insertion stays seed-sensitive even at 1B. The state median miss follows from the per-dimension error accumulation noted with Table 1. Three items remain open. Deletion magnitudes sit far below the 0.5-nat bar. C1 correlations sit far above the 0.2 bar. The completeness pass rate sits below the 90% bar. This section reports three targeted experiments that turn each into either an explained property of the model class or a budget effect, and one that recovers the missing magnitude signal.
6.1 Deletion Magnitudes Do Not Track Policy Competence
The natural first hypothesis for the miss is policy weakness. A pretrained-only 170M produces near-constant action chunks, so deleting a few tokens cannot move the action mean far. If that were the cause, a policy that actually solves the task would show larger deletion magnitudes. We therefore ran the full faithfulness protocol on RDT-1B with the authors' fine-tuned weights on PickCube at three evaluation seeds (20 episodes each, with 9, 1, and 5 successes, and 1,199 pooled policy-call rows). The signal filter is inapplicable here, as noted in Table 2.
The result refutes the hypothesis (Table 2, bottom block, and Figure 4). Every ranking-based score improves on the competent policy. Pooled over the three seeds, vision insertion rises from 0.856 to 0.940 and vision deletion falls from 0.317 to 0.288, both robustly past their bars at every seed. Language deletion moves from failing (0.477) to passing (0.267), while language insertion improves from 0.504 to a pooled 0.541 that still sits just under its 0.55 bar and passes at only two of the three seeds. The deletion magnitude moves the other way. at shrinks from 0.0032 to a pooled 0.00015 nats on vision and from 0.0004 to a pooled 0.00012 on language. The language comparison spans the baseline deviation recorded in Section 4, while the vision comparison does not.
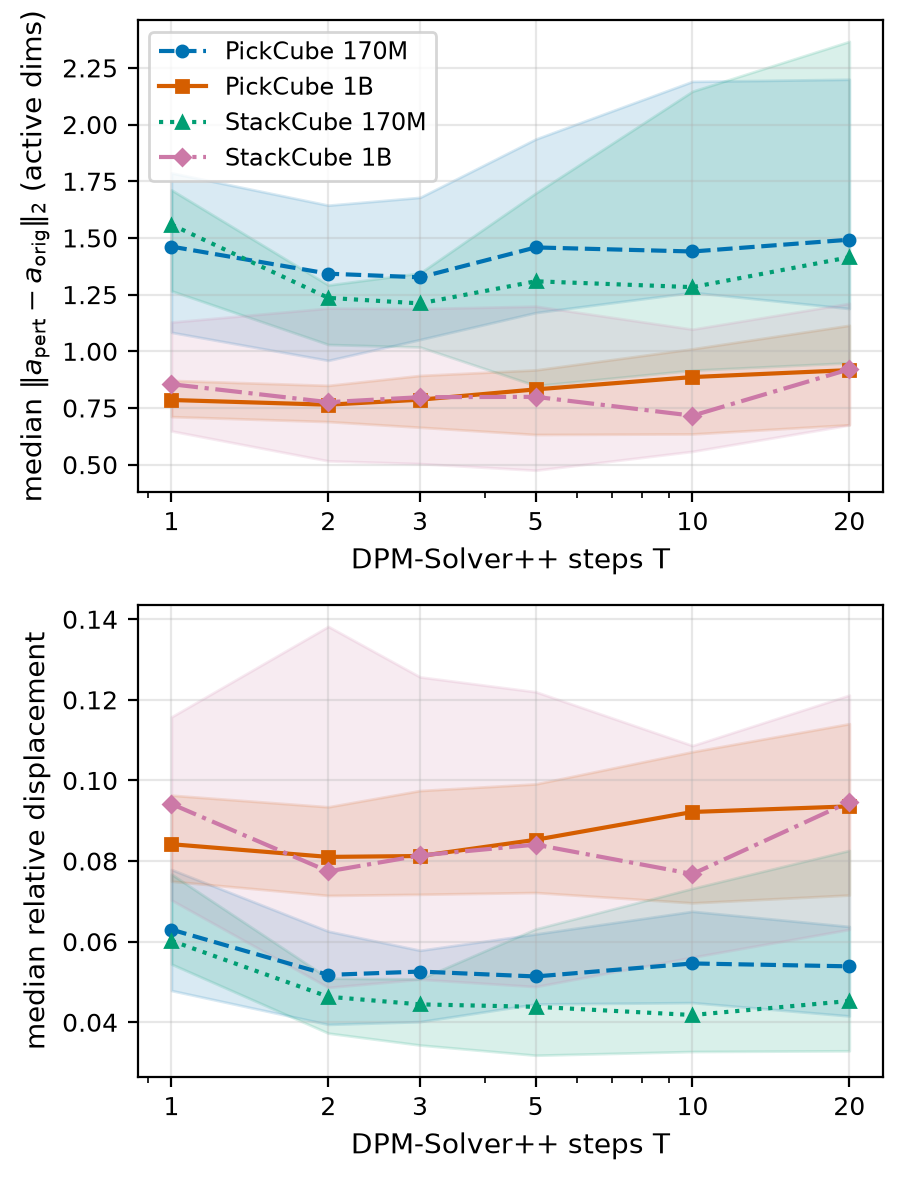
The explanation is the readout, not the denoiser. We measured the action displacement directly by deleting the top-ranked tokens and re-running the policy across solver-step counts, across both model scales, and on two tasks (Figure 5). Three facts follow. The deleted action does move, with median relative displacements of 4.4 to 8.5% of the action norm at top-5% vision deletion under the production five-step chain, so the action is not held fixed by the chain. Between the two-step and twenty-step endpoints the displacement does not progressively contract on any curve, with endpoint changes from 2.3 to 22.2%. The PickCube 1B curve rises by 15%, the 170M curves stay roughly flat in relative terms, and the two StackCube curves dip at intermediate steps before rising again by step twenty. The iterative denoiser therefore does not pull the perturbation back with solver depth. The single-step chain at sits above the two-step value on every curve, so the only contraction in the data is the gap between one-step and iterative solving rather than a pullback that deepens with iteration depth. The cross-scale magnitude gap is a regime effect, not evidence of robustness. The fine-tuned 1B operates at a roughly 3 smaller action norm. At the matched top-5% deletion fraction its relative displacement is at least as large as the 170M value at every solver-step count, with PickCube medians of 8.5% against 5.1% at . The 1B displaces relatively more, which rules out any reading where the stronger policy resists the perturbation, and the non-overlapping action-norm regimes preclude a controlled cross-scale robustness comparison. The small therefore comes from the readout. The log-density reads the squared displacement averaged over the active entries, so a 170M-scale move of 5% of the action norm becomes a magnitude near nats by construction. The linear-readout target in Section 6.2 reports this same displacement directly without the quadratic per-entry averaging, which is why it recovers a usable magnitude. The absolute scale of also depends on the normalization convention (Section 3.5). Under the sum-form target , without the factor, every reported value scales by . That convention would put the 170M vision magnitudes at roughly 0.7 to 2.0 nats (above the 0.5 bar) and the 1B value near 0.08 (below it). The convention is identical across the 170M and 1B runs, so the cross-scale direction is unaffected, but any fixed magnitude bar is meaningful only relative to a stated convention. The practical consequence is a measurement rule. For diffusion policies, magnitude-based faithfulness bars inherited from classifier evaluation do not transfer to a log-density target. The magnitude shrank as the policy improved in our cross-scale comparison, and its relation to any fixed bar depends on the normalization convention. Ranking-based insertion/deletion metrics remain discriminative and well-behaved. We state the scope plainly. The cross-scale displacement evidence is observational and comes from two tasks at two seeds at 1B scale and one seed at 170M, with 8 to 40 episodes per curve. The faithfulness scale check covers one task at three seeds. The 1B rows are also unfiltered, because the fine-tuned policy operates below the signal threshold throughout, which is a population difference from the 170M block. The seed 42 1B run also carries the embedding provenance change recorded in Section 4, and the seed 142 and 242 runs used embeddings encoded on their own machine. Even so, the direction of the effect admits no weak-policy reading, since the vision magnitude shrinks by 20 while every AUC improves.
6.2 A Target Ablation Recovers the Magnitude Signal
If the quadratic log-density is structurally flat under perturbation, a target with non-vanishing gradients near the reference should recover signal. Table 4 compares the three targets of Sections 3.2 and 3.3 on PickCube (both seeds, ).
| Target | Completeness | Faithfulness | |||||
|---|---|---|---|---|---|---|---|
| med err | 3% | @5 | Ins | Del | |||
| 1.86 | 76.8 | 699 | −0.0014 | 0.883 | 0.448 | 750 | |
| 4.73 | 10.7 | 721 | −1.2299 | 0.755 | 0.284 | 774 | |
| maxdev | 6.67 | 10.9 | 713 | −0.1562 | 0.723 | 0.273 | 765 |
The raw target delivers at of 1.23, which is 2.5 the 0.5 magnitude bar in absolute value. Its AUCs remain faithful, with insertion at 0.755 and deletion at 0.284, both passing. The maximum-deviation target improves the magnitude by roughly 110 over on this matched population but falls short of the bar. On the same matched population the deletion AUC misses its 0.40 bar, at 0.448 with a 95% interval of 0.408 to 0.504, while both alternative targets pass it. The main-pass deletion verdict therefore does not carry over to this harder 0-success population. The units caveat from Section 3.3 applies strongly here. The bar was defined for in nats, while the change is measured in action-space units, and the two targets are monotone transformations of the same displacement. The comparison therefore establishes that a usable deletion signal exists under an alternative target, not that the same physical quantity crossed the same bar. The median completeness denominators differ by orders of magnitude across targets (0.0120 for against 3.5194 for ), which underscores that the scales are not interchangeable.
The signal is paid for in completeness. The vision pass rate collapses from 76.8% under to 10.7% for and 10.9% for maxdev on the same re-run. The median error itself also misses the 3% bar, at 4.73% for and 6.67% for maxdev against 's 1.86%, so alternative-target maps are not completeness-verified at this budget. The cause is the same property that creates the signal. The square root in and the max in maxdev have gradient kinks, and the uniform Riemann sum in Eq. 2 aliases against non-smooth integrands. This fattens the completeness tail at exactly as the Riemann sum's smoothness requirement predicts. The practical recommendation follows directly. Use when completeness-verified attribution maps are the product, and use when perturbation magnitude is the quantity of interest, at higher if both matter. Together with Section 6.1, this closes the magnitude story. The canonical target cannot produce the signal, the reason is structural, and a target that can is available with an explicit, measured tradeoff.
6.3 Why Model Randomization Does Not Collapse IG
The standard C1 result () admits a benign explanation. Our log-density target is recomputed under the perturbed model, so the target moves with the randomization, and gradients could stay correlated for that reason alone. The frozen-target variant eliminates that explanation, and the correlation persists. It lands at on vision, essentially unchanged from the moving-target value of roughly 0.95. Randomizing the entire backbone (the cascade variant) degrades vision correlation only to 0.713 and leaves language at 0.910 (Figure 6). Excluding the PickSingleYCB rows, which carry the embedding proxy recorded in Section 4, moves the frozen language value from 0.862 to 0.843. It moves every other frozen and cascade value by at most 0.024 and leaves the cascade language value unchanged.
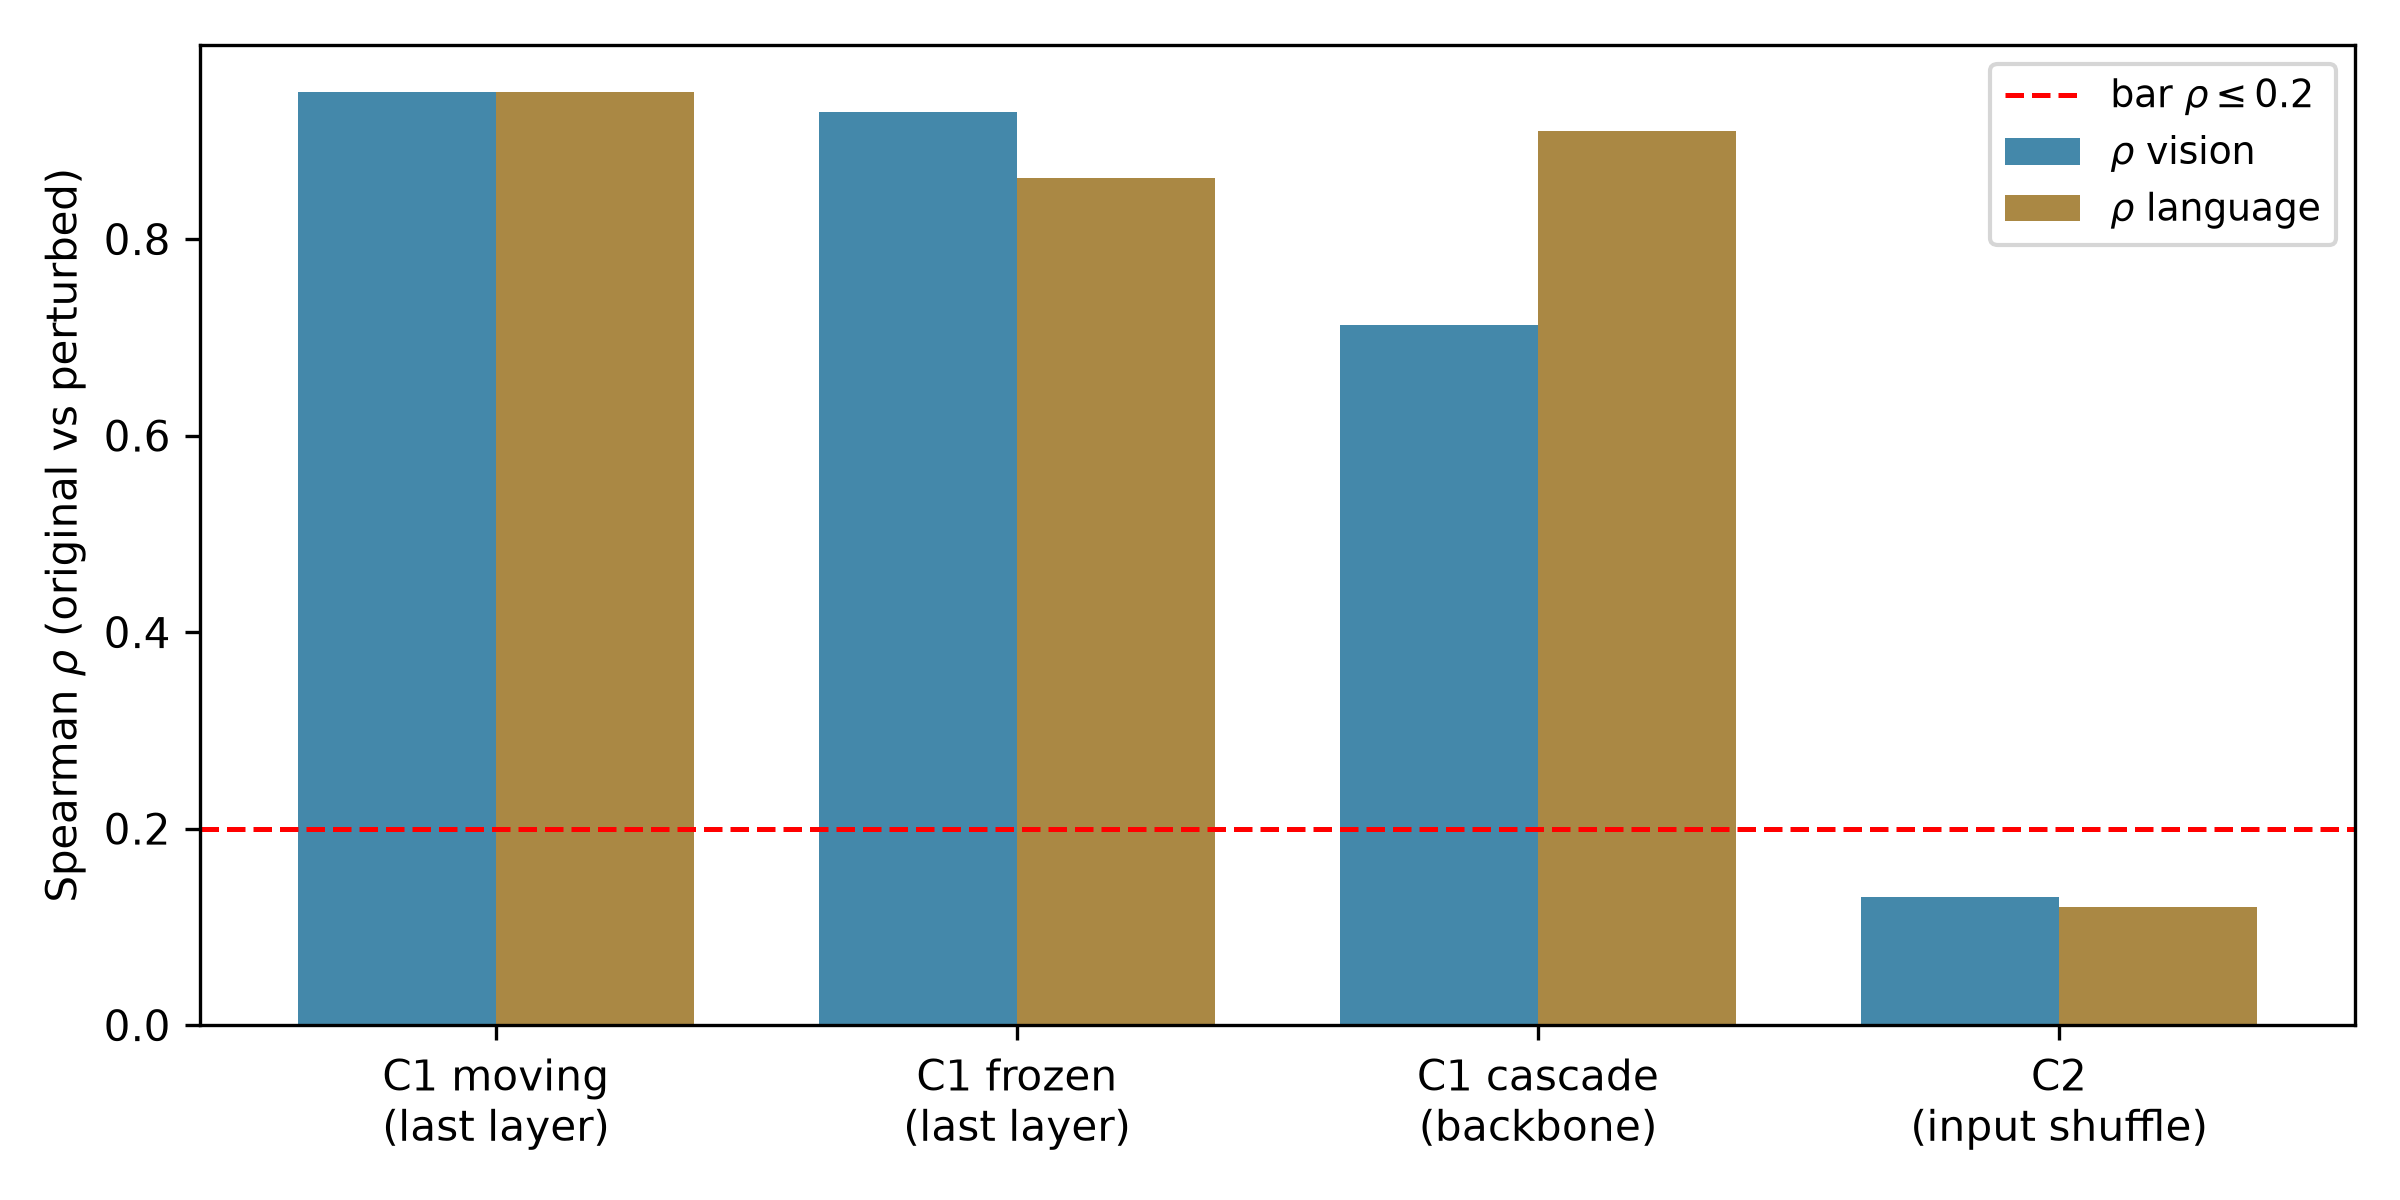
The explanation is visible in Eq. 1. Every IG attribution carries the multiplicative factor , which does not depend on the model at all. Patch scores are dominated by the positions that differ most from the baseline. In the camera image these are the cube, the arm, and the goal site, and in the instruction these are the content tokens. Gradients, random or not, flow preferentially through high-delta positions, so the spatial ranking survives weight randomization. Vision degrades gracefully with randomization depth because deeper re-initialization scrambles more of the attention pattern shaping the gradient. Language barely degrades because token-embedding deltas dominate even more strongly there. This is precisely the partial model-invariance of input-multiplied methods reported by Adebayo et al. [2018] for classifiers, here measured across randomization depths on a diffusion-policy VLA. The consequence for practice mirrors Section 6.1. C1 with a bar is not a meaningful pass/fail test for IG-family methods on VLAs. Input randomization (C2), which directly destroys the input structure the attribution is anchored to, is the check that discriminates (Table 3). The depth study also calibrates how to read the paper's own qualitative artifacts. Under full-backbone randomization the vision ranking retains the larger model-dependent component (), while the language ranking is almost entirely input-anchored (). This is why Section 5.4 treats token bars as input-locating rather than grounding evidence.
Baseline sensitivity corroborates the anchoring account (Table 5). Between the two uninformative baselines (black and gray), patch rankings agree at on both tasks tested, so the production gray choice is not load-bearing. Against a content-aware Gaussian-blur baseline the rankings diverge, with between 0.45 and 0.55. Blur shares spatial structure with the input, which shortens and redirects the integration path and changes the anchor itself. The divergence is expected under the anchoring account, and it is informative precisely because it makes the anchor visible.
| Task | black vs gray | black vs blur | gray vs blur |
|---|---|---|---|
| PickCube | 0.825 | 0.539 | 0.455 |
| StackCube | 0.814 | 0.546 | 0.496 |
6.4 The Completeness Tail Is Budget-Bound on the Smooth Tasks
Table 6 reports the study. Two comparisons must be kept apart because of the episode-length configuration change described in Section 4. The matched comparison truncates rows to the episode shape. There, doubling lifts the PickCube vision pass rate from 68.6% to 80.5% and StackCube from 59.9% to 89.8%, with StackCube essentially reaching the 90% bar, while medians stay near 2%. The matched views are small ( and ), so these point estimates carry wide sampling intervals. The full view retains every policy call of each episode, including deep mid-trajectory rows the pass never sampled. It is the richer dataset but not a like-for-like comparison, and its pooled pass rates (72.9% and 62.0%) reflect that harder row mix rather than a regression. The faithfulness rows behave the same way. The released seed-42 faithfulness records are excluded from the quoted values because the provenance fingerprint of Section 3.5 proves that they consumed seed-142 sidecars. On the fingerprint-verified seed-142 rows, vision insertion AUC is 0.74 on PegInsertionSide (0.72 after the resume-replay deduplication documented in the released data README) and 0.95 on PickSingleYCB. The decommissioned PickCube and StackCube records, whose both-seed pooling carries the disclosed seed exposure, recorded 0.86 on both tasks. The full-view deletion AUC drifts above the 0.40 bar on harder full-episode row mixes, to 0.476 on the verified PickSingleYCB rows and 0.444 on the decommissioned StackCube record. The verification pass's clean seed-42 arm (Section 4) reproduces both claims, with insertion at 0.79 on PegInsertionSide and 0.91 on PickSingleYCB and with PickSingleYCB deletion again above the bar at 0.442.
| Task | View | |||
|---|---|---|---|---|
| PickCube | matched | 68.6 | 80.5 | 41 |
| StackCube | matched | 59.9 | 89.8 | 49 |
| PickCube | full | 68.6 | 72.9 | 377 |
| StackCube | full | 59.9 | 62.0 | 379 |
| PegInsertion | full | 75.8 | 64.0 / 77.0 | 189 / 178 |
| PickYCB | full | 69.8 | 73.7 / 71.8 | 194 / 195 |
The honest reading has three parts. First, on the smooth tasks the tail is demonstrably budget-bound. A matched doubling of moves the pass rate by 11.9 and 29.9 points, which is the behavior the Riemann convergence argument predicts, with medians unchanged. The median was never the problem. Second, the two later-added tasks do not move cleanly in the full view. PegInsertionSide lands at 64.0 to 77.0% across seeds, straddling its 75.8% reference, and PickSingleYCB rises modestly to 71.8 to 73.7%. Their episodes are dominated by long failure trajectories whose mid-episode rows carry longer-tailed integrands, and the full-view row mix differs from the reference, so these cells are not like-for-like. Third, only StackCube reaches the neighborhood of the 90% bar. PickCube lands at 80.5% in the matched view and the two later-added tasks stay at 64.0 to 77.0%, so we make no extrapolation claim about higher beyond the smooth-task evidence. Completeness medians of roughly 2% with a budget-dependent tail are, in our assessment, an accurate summary of what per-step IG delivers on this model class at practical integration budgets.
7 Discussion
What this means for evaluating attribution on diffusion policies.
The two mechanisms reframe how attribution quality should be measured on this model class. Magnitude-based faithfulness thresholds are inherited from classifier studies, where deleting salient evidence collapses the prediction. Under a log-density target on a diffusion policy they mislead. The magnitude is a quadratic per-entry readout of a small action displacement. The smaller absolute displacement at 1B reflects its smaller action-norm regime while its relative displacement is at least as large, and the magnitude's relation to any fixed bar depends on the normalization convention. Ranking-based insertion/deletion AUCs remain discriminative and should carry the faithfulness verdict. Model-randomization sanity bars calibrated for pure-gradient saliency are similarly miscalibrated for input-multiplied methods. Input randomization is the check that separates signal from anchor. The attribution target is also a design degree of freedom, not a fixed convention. Use the log-density for completeness-verified maps and the raw when perturbation magnitude matters. None of these adjustments weaken the evaluation. They relocate it to the metrics that actually discriminate on this model class.
Limitations.
The cross-scale displacement comparison covers two tasks at two seeds at 1B scale, and the target ablation covers one task. Both invite replication at scale. The 1B evaluation seeds vary the rollouts and the sampling on one fixed checkpoint, so they bound rollout and sampling variance and not generalization across training initializations. The tables report medians or pooled pass rates, and rows within an episode are correlated, so row-level overstates the effective sample size. The 1,199 pooled 1B rows, for example, come from 60 episodes. We mitigate this by reporting per-seed values where populations differ and by scoping claims to directions and orders of magnitude. The tables also make many pass or fail comparisons against pre-specified bars without a multiplicity correction, and we read them as descriptive summaries rather than inferential tests. Episode-level bootstrap intervals accompany Figure 5 and ship as interval tables for every released run that backs a published table, while the decommissioned runs remain without intervals. The distribution figures (Figures 1 and 2) and the in-text AUC values are not accompanied by interval tables. The primary evaluation deliberately uses a pretrained-only 170M policy, which exercises failure behavior but caps language-grounding effects. State-modality completeness misses the 3% median bar at , at 4.53 to 7.46%, which we attribute to error accumulation over the eight active dimensions and to small completeness denominators on state rows. The insertion and deletion faithfulness protocol is reported for the vision and language modalities only, so the state modality carries completeness and sanity verdicts but no perturbation faithfulness AUC. State perturbation faithfulness is left to future work because the eight active state dimensions offer no graded deletion grid comparable to the 729 vision patches or the instruction token sequence. For the same coverage reason C2 randomizes only the vision and language inputs, and a state-dimension permutation variant would give state a discriminating input-randomization check, which we also leave to future work. State is therefore the modality this evaluation covers least. The C2 language shuffle operates on post-encoding token order rather than pre-encoding text, because a T5 re-encoding was unavailable at run time. The shuffled embeddings cover the same vocabulary, and the check still passes on three of four tasks. The StackCube C2 language reading (0.240) is borderline for the stated repeated-token reason. The baseline-sensitivity study covers the vision modality only. The follow-up language attributions carry the baseline and embedding deviations recorded in Section 4. The failure taxonomy is assigned algorithmically from completeness signatures rather than by human annotation, and it merges spurious-background cases into vision misfocus and ambiguous-instruction cases into language misgrounding. All findings come from a single model family (RDT) in a single simulator (ManiSkill3), and the 1B faithfulness evaluation covers a single task. All results are in simulation.
Engineering notes.
Three decisions proved load-bearing. A zero-vector language baseline is numerically safe but semantically degenerate, and the minimal two-token baseline roughly halved the completeness error relative to the zero vector in preliminary tests. Identical re-seeding of the diffusion noise across all forward passes is strictly necessary. Without it the target is stochastic, IG is undefined, and the completeness identity fails. Per-policy-call granularity, rather than per-environment-step, reduces full-episode attribution cost by roughly 16 and is what makes 400-episode protocols practical.
Future directions.
Smoother-attribution methods [Jha et al., 2021; Jha et al., 2022] and decision-focused integration [Walker et al., 2024] are natural fits for the target's completeness tail, since both attack exactly the non-smooth-integrand regime. A full 1B evaluation across more tasks would test whether the relative displacement ordering between scales persists. Extending the action-space displacement measurement to more tasks, more seeds, and real hardware would broaden the cross-scale evidence. Episode-level bootstrap intervals for the decommissioned main-pass tables would further tighten the empirical story. Real-robot replication would test whether the attribution patterns and both structural findings transfer outside simulation.
8 Conclusion
We presented a per-step, per-modality Integrated Gradients framework for diffusion-policy vision-language-action models and evaluated it systematically on RDT across four ManiSkill3 tasks. Median completeness errors land at 1.9 to 2.5% on vision and language, vision faithfulness AUCs pass pre-specified bars on every task in the main evaluation, and input-randomization sanity passes on vision throughout. Where the protocol's classifier-bred thresholds were missed, we isolated the reasons experimentally and, where possible, engineered around them. In our cross-scale comparison, deletion log-density magnitudes shrank rather than grew as the policy improved, which a direct measurement traces to the quadratic per-entry readout acting on a smaller-magnitude action rather than to any greater robustness. Model-randomization correlations persist because IG is input-anchored, which we showed across randomization depths. The completeness tail is integration-budget-bound on the smooth tasks, which we showed by matched -doubling. A raw target recovers a usable deletion magnitude with an explicit completeness tradeoff. We read these not as failures of attribution on diffusion policies but as the measurement theory required to evaluate it honestly, and we release the pipeline code, the committed per-step metrics records, and the analysis notebooks for replication.
Ethical Statement
This work analyzes pretrained robotic manipulation policies in simulation. No human subjects were involved. The interpretability methods presented here are intended to improve the transparency and safety of robotic systems.
Reproducibility Statement
Per-step completeness metrics are emitted as JSONL records with one row per policy call, carrying the per-modality errors, IG sums, action norm, and wall time. The faithfulness and sanity post-processing stages write companion JSONL files keyed to the same steps. The original protocol asked for one consolidated metrics file, and this multi-file layout is a deviation from that requirement. The published table values apply the signal-bearing filter of Section 4, and the matched-view and ablation columns derive from their records under the filters stated in their captions. Episode seeds are fixed at 42 and 142, with 242 added for the third RDT-1B evaluation seed, where episode uses seed , , or , and the diffusion noise is seeded per forward pass. Single-command scripts regenerate the full pass, faithfulness, sanity, target-ablation, and displacement stages from the fixed seeds, with the exact commands as executed on the original GPUs, except for the later strengthening runs. The seed 142 and 242 RDT-1B faithfulness runs, the matched-population ablation runs, and the seed 142 displacement runs used the same entry points and flags at the seeds and scopes recorded in the released data README. The RDT-1B stages additionally require the RDT authors' ManiSkill fine-tuned checkpoint from the robotics-diffusion-transformer maniskill-model repository on Hugging Face. Without it the loader falls back to the Hugging Face base weights, applying this project's local PickCube low-rank adaptation (LoRA) fine-tune only when its checkpoint exists, and neither fallback reproduces the published 1B numbers. The committed records are not a byte-level reproduction of every table. Six artifact families were produced on cloud GPUs that have since been decommissioned. They are the main evaluation pass and its faithfulness records, the original PickCube and StackCube subset, the standard sanity runs, the initial RDT-1B scale-check run, the per-step attribution sidecars, and the overlay images. None of them are part of the release. The records we release are the regeneration run of Section 4, which reproduces the target ablation and corroborates the main-pass protocol at a smaller episode budget. The release also holds the RDT-1B faithfulness records at all three evaluation seeds, the PegInsertionSide and PickSingleYCB runs, the frozen-target and cascade sanity runs, and the baseline-sensitivity and target-ablation runs including the matched-population pair. It further holds the six displacement records behind Figure 5, the RDT-1B base attribution runs behind the second displacement seed, the Month 5 1B reproduction records, and a validation record for the displacement identity. The RDT-170M main-pass values were computed from the now-decommissioned main-pass records and are not regenerable from the committed data. These are the completeness values in Table 1, the RDT-170M block of Table 2, and the standard C1 and C2 rows of Table 3. The three-seed RDT-1B rows of Table 2 and the frozen-target and cascade rows of Table 3 are computed from the committed records and regenerate exactly from them, with bootstrap intervals in the released interval tables. The released analysis notebooks preserve the Table 1 values exactly and retain the other analyses over broader unfiltered row populations. A README maps each committed file to the run it represents. Two committed records are retained with a known defect rather than silently replaced: the seed-42 faithfulness files consumed seed-142 sidecars through the pre-fix shared filenames, as the released audit script proves through the gap-identity fingerprint of Section 3.5, and the README marks them accordingly; no published value derives from them. The Month 7 verification records were produced by a single recorded script that reran the full pass, its faithfulness, the standard sanity checks, and the seed-42 arm with seed-tagged sidecars; they reproduce every published verdict they test, and their episode-bootstrap intervals ship with the released interval tables. Attribution sidecar tensors are too large to distribute and are regenerable from the fixed-seed scripts. Hardware and library versions can shift episode lengths and success counts, as the Month 5 reproduction run shows, while the reproduced medians stay inside the episode bootstrap intervals. Code, records, interval tables, and the analysis notebooks are available at https://github.com/itscool2b/the-readout-not-the-denoiser-repo.
Acknowledgments
I am sincerely grateful to Professor Sumit K. Jha, Department of Computer and Information Science and Engineering, University of Florida, and to Brian Rodriguez, University of Florida, for mentoring and guiding me throughout this seven-month project. I thank them for their time and technical advice.
References
- [Adebayo et al., 2018] Julius Adebayo, Justin Gilmer, Michael Muelly, Ian J. Goodfellow, Moritz Hardt, and Been Kim. Sanity checks for saliency maps. In Advances in Neural Information Processing Systems (NeurIPS), volume 31, pages 9525–9536, 2018.
- [Amitai et al., 2024] Yotam Amitai, Yael Septon, and Ofra Amir. Explaining reinforcement learning agents through counterfactual action outcomes. In Proceedings of the AAAI Conference on Artificial Intelligence, volume 38, pages 10003–10011, 2024.
- [Bojarski et al., 2018] Mariusz Bojarski, Anna Choromanska, Krzysztof Choromanski, Bernhard Firner, Larry Jackel, Urs Muller, Philip Yeres, and Karol Zieba. VisualBackProp: Efficient visualization of CNNs for autonomous driving. In Proceedings of the IEEE International Conference on Robotics and Automation (ICRA), pages 4701–4708, 2018.
- [Chi et al., 2023] Cheng Chi, Siyuan Feng, Yilun Du, Zhenjia Xu, Eric Cousineau, Benjamin Burchfiel, and Shuran Song. Diffusion policy: Visuomotor policy learning via action diffusion. In Proceedings of Robotics: Science and Systems (RSS), 2023.
- [Greydanus et al., 2018] Samuel Greydanus, Anurag Koul, Jonathan Dodge, and Alan Fern. Visualizing and understanding Atari agents. In Proceedings of the 35th International Conference on Machine Learning (ICML), pages 1792–1801, 2018.
- [Ho et al., 2020] Jonathan Ho, Ajay Jain, and Pieter Abbeel. Denoising diffusion probabilistic models. In Advances in Neural Information Processing Systems (NeurIPS), volume 33, pages 6840–6851, 2020.
- [Hooker et al., 2019] Sara Hooker, Dumitru Erhan, Pieter-Jan Kindermans, and Been Kim. A benchmark for interpretability methods in deep neural networks. In Advances in Neural Information Processing Systems (NeurIPS), volume 32, pages 9734–9745, 2019.
- [Jha et al., 2021] Sumit Kumar Jha, Rickard Ewetz, Alvaro Velasquez, and Susmit Jha. On smoother attributions using neural stochastic differential equations. In Proceedings of the 30th International Joint Conference on Artificial Intelligence (IJCAI), pages 522–528, 2021.
- [Jha et al., 2022] Sumit Kumar Jha, Rickard Ewetz, Alvaro Velasquez, Arvind Ramanathan, and Susmit Jha. Shaping noise for robust attributions in neural stochastic differential equations. In Proceedings of the AAAI Conference on Artificial Intelligence, volume 36, pages 9567–9574, 2022.
- [Kapishnikov et al., 2021] Andrei Kapishnikov, Subhashini Venugopalan, Besim Avci, Ben Wedin, Michael Terry, and Tolga Bolukbasi. Guided integrated gradients: An adaptive path method for removing noise. In Proceedings of the IEEE/CVF Conference on Computer Vision and Pattern Recognition (CVPR), pages 5050–5058, 2021.
- [Liu et al., 2025] Songming Liu, Lingxuan Wu, Bangguo Li, Hengkai Tan, Huayu Chen, Zhengyi Wang, Ke Xu, Hang Su, and Jun Zhu. RDT-1B: a diffusion foundation model for bimanual manipulation. In Proceedings of the International Conference on Learning Representations (ICLR), 2025.
- [Lu et al., 2025] Cheng Lu, Yuhao Zhou, Fan Bao, Jianfei Chen, Chongxuan Li, and Jun Zhu. DPM-Solver++: Fast solver for guided sampling of diffusion probabilistic models. Machine Intelligence Research, 22(4):730–751, 2025.
- [Mudrakarta et al., 2018] Pramod Kaushik Mudrakarta, Ankur Taly, Mukund Sundararajan, and Kedar Dhamdhere. Did the model understand the question? In Proceedings of the 56th Annual Meeting of the Association for Computational Linguistics (Volume 1: Long Papers), pages 1896–1906, 2018.
- [Octo Model Team et al., 2024] Octo Model Team, Dibya Ghosh, Homer Walke, Karl Pertsch, Kevin Black, Oier Mees, et al. Octo: An open-source generalist robot policy. In Proceedings of Robotics: Science and Systems (RSS), 2024.
- [Petsiuk et al., 2018] Vitali Petsiuk, Abir Das, and Kate Saenko. RISE: Randomized input sampling for explanation of black-box models. In Proceedings of the British Machine Vision Conference (BMVC), 2018.
- [Raffel et al., 2020] Colin Raffel, Noam Shazeer, Adam Roberts, Katherine Lee, Sharan Narang, Michael Matena, Yanqi Zhou, Wei Li, and Peter J. Liu. Exploring the limits of transfer learning with a unified text-to-text transformer. Journal of Machine Learning Research, 21(140):1–67, 2020.
- [Rong et al., 2022] Yao Rong, Tobias Leemann, Vadim Borisov, Gjergji Kasneci, and Enkelejda Kasneci. A consistent and efficient evaluation strategy for attribution methods. In Proceedings of the 39th International Conference on Machine Learning (ICML), pages 18770–18795, 2022.
- [Sundararajan et al., 2017] Mukund Sundararajan, Ankur Taly, and Qiqi Yan. Axiomatic attribution for deep networks. In Proceedings of the 34th International Conference on Machine Learning (ICML), pages 3319–3328, 2017.
- [Tang et al., 2023] Raphael Tang, Linqing Liu, Akshat Pandey, Zhiying Jiang, Gefei Yang, Karun Kumar, Pontus Stenetorp, Jimmy Lin, and Ferhan Ture. What the DAAM: Interpreting Stable Diffusion using cross attention. In Proceedings of the 61st Annual Meeting of the Association for Computational Linguistics (Volume 1: Long Papers), pages 5644–5659, 2023.
- [Tao et al., 2024] Stone Tao, Fanbo Xiang, Arth Shukla, Yuzhe Qin, Xander Hinrichsen, Xiaodi Yuan, Chen Bao, Xinsong Lin, Yulin Liu, Tse-kai Chan, et al. ManiSkill3: GPU parallelized robotics simulation and rendering for generalizable embodied AI. arXiv preprint arXiv:2410.00425, 2024.
- [Tomsett et al., 2020] Richard Tomsett, Dan Harborne, Supriyo Chakraborty, Prudhvi Gurram, and Alun D. Preece. Sanity checks for saliency metrics. In Proceedings of the AAAI Conference on Artificial Intelligence, volume 34, pages 6021–6029, 2020.
- [Walker et al., 2024] Chase Walker, Sumit Kumar Jha, Kenny Chen, and Rickard Ewetz. Integrated decision gradients: Compute your attributions where the model makes its decision. In Proceedings of the AAAI Conference on Artificial Intelligence, volume 38, pages 5289–5297, 2024.
- [Walker et al., 2025a] Chase Walker, Md Rubel Ahmed, Sumit Kumar Jha, and Rickard Ewetz. Explaining ViTs using information flow. In Proceedings of the International Conference on Artificial Intelligence and Statistics (AISTATS), pages 2440–2448, 2025.
- [Walker et al., 2025b] Chase Walker, Sumit Kumar Jha, and Rickard Ewetz. Metric-driven attributions for vision transformers. In Proceedings of the International Conference on Learning Representations (ICLR), 2025.
- [Zhai et al., 2023] Xiaohua Zhai, Basil Mustafa, Alexander Kolesnikov, and Lucas Beyer. Sigmoid loss for language image pre-training. In Proceedings of the IEEE/CVF International Conference on Computer Vision (ICCV), pages 11975–11986, 2023.
- [Zitkovich et al., 2023] Brianna Zitkovich, Tianhe Yu, Sichun Xu, Peng Xu, Ted Xiao, Fei Xia, et al. RT-2: Vision-language-action models transfer web knowledge to robotic control. In Proceedings of the 7th Conference on Robot Learning (CoRL), pages 2165–2183, 2023.